Margin note
Construction is a project. Maintenance is a calendar.
The ribbon gets cut. Construction photographs circulate. The crews collect their equipment, the temporary offices disappear, and the financing moves on to the next announcement.
The asset stays where they left it.
A turbine, solar array, battery system, substation, or transmission asset now has to operate through heat, vibration, wear, alarms, inspections, and component failures. Machinery remains politely indifferent to the narrative that financed it.
This is where the analysis becomes interesting. Large capital programs attract large crowds. The question worth asking is how many commissioned assets a qualified team can actually reach, inspect, and service.
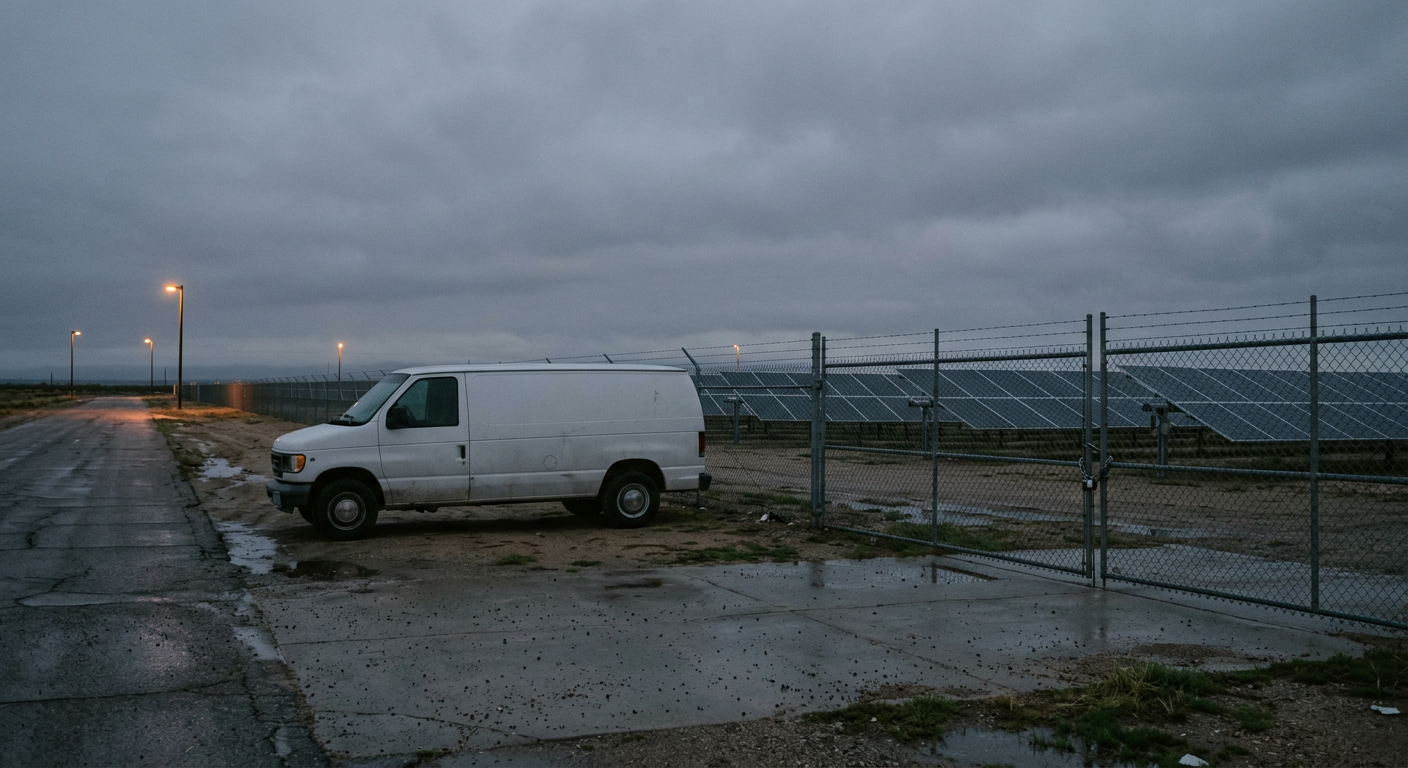
Long after the cameras leave, a service vehicle approaches the gate.
The Number Underneath the Ribbon
The Inflation Reduction Act was scored at roughly $370 billion for clean energy in 2022, though subsequent legislation has curtailed much of that credit structure — one more reason to underwrite commissioned assets rather than announced policy. That expands the potential installed base, although it does not prove that every announced project gets built, earns an acceptable return, or creates work for an independent provider.
Equipment already commissioned or visibly under construction is the safer starting point. Steel in the ground is more persuasive than enthusiasm in a press release.
Operations and maintenance accounted for roughly 20–25% of lifecycle cost for European wind and solar plants as of 2017, a share that rises as capex per kW falls. For a hypothetical project with $100 million in lifecycle cost, that implies $20–25 million of O&M over its operating life. A quarter of the whole project economics sits on the far side of the ribbon-cutting.
That is not one cheque waiting for one contractor. It arrives across years, sites, equipment categories, monitoring, inspections, preventive work, corrective repairs, and component servicing. Each piece must be won and performed separately.
Construction is a project. Maintenance is a calendar.
"Recurring" Needs an Autopsy
Recurring revenue is one of those phrases that becomes less informative each time it appears in a presentation.
Energy O&M includes monitoring, scheduled servicing, corrective work, and maintenance of turbines, inverters, battery systems, substations, and lines. Those streams do not deserve the same valuation merely because they happen more than once.
Scheduled work may be predictable but competitively priced. Emergency work can produce attractive invoices while damaging crew utilization. Some work may be performed internally. Equipment requirements can also limit which providers are qualified to touch a particular asset.
The physical demand floor remains. Deferral does not abolish wear; it tends to convert manageable work into emergency labour, expedited parts, downtime, and a customer who has suddenly discovered the value of planning.
Industrial maintenance benchmarks show the broader mechanic. Maintenance cost as a percentage of replacement asset value is the standard yardstick. SMRP's top-quartile range runs from about 0.7% to 3.6% depending on industry, with roughly 2–3% a common world-class marker; benchmarks for reactive plants vary across sources from 6% up to 10%. SMRP also warns that a low ratio can mean under-maintenance rather than excellence. A plant at 6% is usually not maintaining twice the equipment of a plant at 3%. It is often performing substantially the same work at two or three times the unit cost because everything has become urgent.
A plant benchmark should not be transferred mechanically onto every wind or solar site. The cost logic still travels well. A capable servicer creates value by moving work onto a schedule rather than waiting for something expensive to fail.
Separate revenue into scheduled, corrective, emergency-driven, internally captured, and otherwise restricted buckets. Until the mix is known, "recurring" is decoration.
The National Market Disappears at Road Level
Aggregate spending numbers are useful for conference slides and nearly useless for describing the work a crew can perform on Tuesday.
The executable market consists of assets within a practical response radius, filtered by technician qualifications, equipment specialization, travel time, and available service windows. A national installed base can be enormous while the economically reachable market remains stubbornly local.
Density changes the economics. More serviceable assets inside a workable radius mean higher technician utilization, faster response, and less time behind a windshield. A scattered backlog can report impressive revenue while producing weak economics after travel and standby requirements consume the schedule.
A disciplined analyst would rather see a modest territory with dense routes than a heroic map covered in dots.
Capital has limited power over this constraint. It can buy vehicles, tools, inventory, and acquisitions. It cannot instantly create qualified technicians, local trust, or familiarity with an installed equipment base. A platform can acquire several crews, but it has acquired several local operating networks that still have to function locally. The logo is the easy part.
That creates the opportunity and sets the ceiling. A collection of contracts may support a good operator while remaining immaterial to a fund that requires scale to justify the work. The market stays protected because it is geographically bounded, relationship-dependent, and too small to absorb much capital without changing its character.
The better capacity denominator is backlog divided by available technician-days after travel and standby. If that figure deteriorates as revenue grows, the company is stretching the map instead of building density.
The Installed Base Is Not the Addressable Market
The maintenance tail is attractive because it outlives the construction cycle. That preference needs supervision.
Installed equipment creates an obligation to perform work, but it does not grant an independent servicer access at an attractive margin. Some demand remains internal. Other work requires specific qualifications or belongs to providers already embedded in the equipment relationship.
Underwrite commissioned assets and visible construction, therefore, rather than assuming every subsidy or forecast arrives intact. Then separate physical maintenance demand from the portion an outside provider can realistically capture.
The relevant variables are qualified headcount, route density, customer concentration, equipment mix, and the amount of work each crew can complete without wasting its week in transit. Hundreds of billions in policy spending may explain why more assets appear. It says very little about how much revenue fits inside one local service operation.
The recurrence can be genuine while the investable capacity remains quite small.
How the Service Thesis Fails
The first failure is confusing proximity with qualification. A nearby operator has no advantage if it lacks the credentials, equipment knowledge, or documented processes required for the work.
The second is mistaking site count for diversification. Ten facilities may still depend on one customer or one equipment category. The map looks broad until the ownership table is unfolded.
Growth can also worsen the business. Adding distant contracts may increase revenue while reducing technician utilization. Emergency work can interrupt scheduled jobs. A shortage of qualified staff can turn backlog into disappointed customers rather than future profit.
The questions worth asking are practical:
- How many customers ultimately control the sites?
- Does growth improve route density or extend travel?
- Can the servicer charge for competence and response time?
- How much work can each qualified technician complete?
- Which revenue is scheduled, and which arrives only after failure?
- Does the customer relationship belong to the business or to one person?
A fine local service company becomes a poor acquisition when priced as though geography, qualification, and trust have stopped mattering.
The Obligation Left on Site
After construction ends, the asset remains fixed behind a gate. It stays exposed to heat, wear, operating demands, and the consequences of delayed work. The service schedule continues without needing publicity.
Nothing here requires predicting which turbine, panel, developer, or policy narrative wins the decade. What matters is who can repeatedly reach the installed equipment, perform qualified work, and preserve the customer relationship without letting travel and standby consume the margin.
That is also where this framework is thinnest. The lifecycle share and the maintenance benchmarks are sector averages borrowed from a different industry and pointed at a site nobody in this argument has walked. Route density and technician-days are the numbers that decide the outcome, and they are exactly the numbers no filing publishes, which means the disciplined-sounding denominator above is a judgment wearing arithmetic as a costume.
The best territory is large enough to support the operator and small enough to remain inconvenient for capital that requires scale. Technician supply and geography limit growth, but they also protect the economics from competitors that need every opportunity to become a platform.
Construction crews leave an energy asset behind. For someone close enough and qualified enough, they also leave a long calendar of appointments.